数据准备
import torch
import torch.nn as nn
import numpy as np
import matplotlib.pyplot as plt

# Set random seed for reproducibility
np.random.seed(0)
torch.manual_seed(0)

# Generate synthetic sine wave data
t = np.linspace(0, 100, 1000)
data = np.sin(t)

# Function to create sequences
def create_sequences(data, seq_length):
    xs = []
    ys = []
    for i in range(len(data)-seq_length):
        x = data[i:(i+seq_length)]
        y = data[i+seq_length]
        xs.append(x)
        ys.append(y)
    return np.array(xs), np.array(ys)

seq_length = 10
X, y = create_sequences(data, seq_length)

# Convert data to PyTorch tensors
trainX = torch.tensor(X[:, :, None], dtype=torch.float32)
trainY = torch.tensor(y[:, None], dtype=torch.float32)
定义模型
class LSTMModel(nn.Module):
    def __init__(self, input_dim, hidden_dim, layer_dim, output_dim):
        super(LSTMModel, self).__init__()
        self.hidden_dim = hidden_dim
        self.layer_dim = layer_dim
        self.lstm = nn.LSTM(input_dim, hidden_dim, layer_dim, batch_first=True)
        self.fc = nn.Linear(hidden_dim, output_dim)

    def forward(self, x):
        h0 = torch.zeros(self.layer_dim, x.size(0), self.hidden_dim).requires_grad_()
        c0 = torch.zeros(self.layer_dim, x.size(0), self.hidden_dim).requires_grad_()
        out, (hn, cn) = self.lstm(x, (h0.detach(), c0.detach()))
        out = self.fc(out[:, -1, :])  # Selecting the last output
        return out
模型训练
model = LSTMModel(input_dim=1, hidden_dim=100, layer_dim=1, output_dim=1)
criterion = nn.MSELoss()
optimizer = torch.optim.Adam(model.parameters(), lr=0.01)

num_epochs = 100
for epoch in range(num_epochs):
    model.train()
    outputs = model(trainX)
    optimizer.zero_grad()
    loss = criterion(outputs, trainY)
    loss.backward()
    optimizer.step()

    if (epoch+1) % 10 == 0:
        print(f'Epoch [{epoch+1}/{num_epochs}], Loss: {loss.item():.4f}')
输出结果为:
Epoch [10/100], Loss: 0.0682
Epoch [20/100], Loss: 0.0219
Epoch [30/100], Loss: 0.0046
Epoch [40/100], Loss: 0.0027
Epoch [50/100], Loss: 0.0010
Epoch [60/100], Loss: 0.0003
Epoch [70/100], Loss: 0.0001
Epoch [80/100], Loss: 0.0000
Epoch [90/100], Loss: 0.0000
Epoch [100/100], Loss: 0.0000
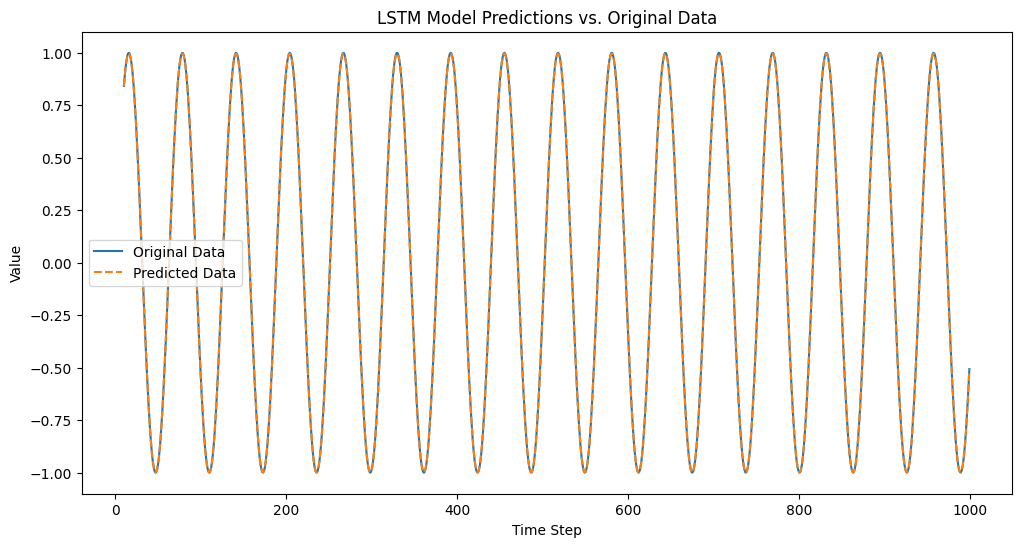
结果可视化
import matplotlib.pyplot as plt

# Predicted outputs
model.eval()
predicted = model(trainX).detach().numpy()

# Adjusting the original data and prediction for plotting
# The prediction corresponds to the point just after each sequence
original = data[seq_length:]  # Original data from the end of the first sequence
time_steps = np.arange(seq_length, len(data))  # Corresponding time steps

plt.figure(figsize=(12, 6))
plt.plot(time_steps, original, label='Original Data')
plt.plot(time_steps, predicted, label='Predicted Data', linestyle='--')
plt.title('LSTM Model Predictions vs. Original Data')
plt.xlabel('Time Step')
plt.ylabel('Value')
plt.legend()
plt.show()
参考:
https://www.geeksforgeeks.org/long-short-term-memory-networks-using-pytorch/

